
File:AreostationaryCoverage.png: Difference between revisions
A plot of an example computed coverage area for an areosynchronous satellite. The constraint used in this example is that the satellite must appear 10 degrees above the horizon in order to maintain coverage. The coverage zone in this image is centered... |
|||
| (One intermediate revision by the same user not shown) | |||
| Line 1: | Line 1: | ||
== Summary == | == Summary == | ||
A plot of | A plot of example coverage areas for satellites in stationary orbit above Mars. The four areas are the approximate coverage zones for satellites in the two stable equilibrium points (yellow) and the two unstable points (cyan). | ||
Plotted with Leaflet using tiles from [https://github.com/openplanetary/opm/wiki/OPM-Basemaps OpenPlanetaryMap] | |||
== Licensing == | == Licensing == | ||
{{CC-by-sa-4.0}} | {{CC-by-sa-4.0}} | ||


Latest revision as of 04:02, 1 September 2018
Summary
A plot of example coverage areas for satellites in stationary orbit above Mars. The four areas are the approximate coverage zones for satellites in the two stable equilibrium points (yellow) and the two unstable points (cyan).
Plotted with Leaflet using tiles from OpenPlanetaryMap
Licensing
Creative Commons Attribution-ShareAlike 4.0 (More Details)
File history
Click on a date/time to view the file as it appeared at that time.
| Date/Time | Thumbnail | Dimensions | User | Comment | |
|---|---|---|---|---|---|
| current | 03:58, 1 September 2018 | 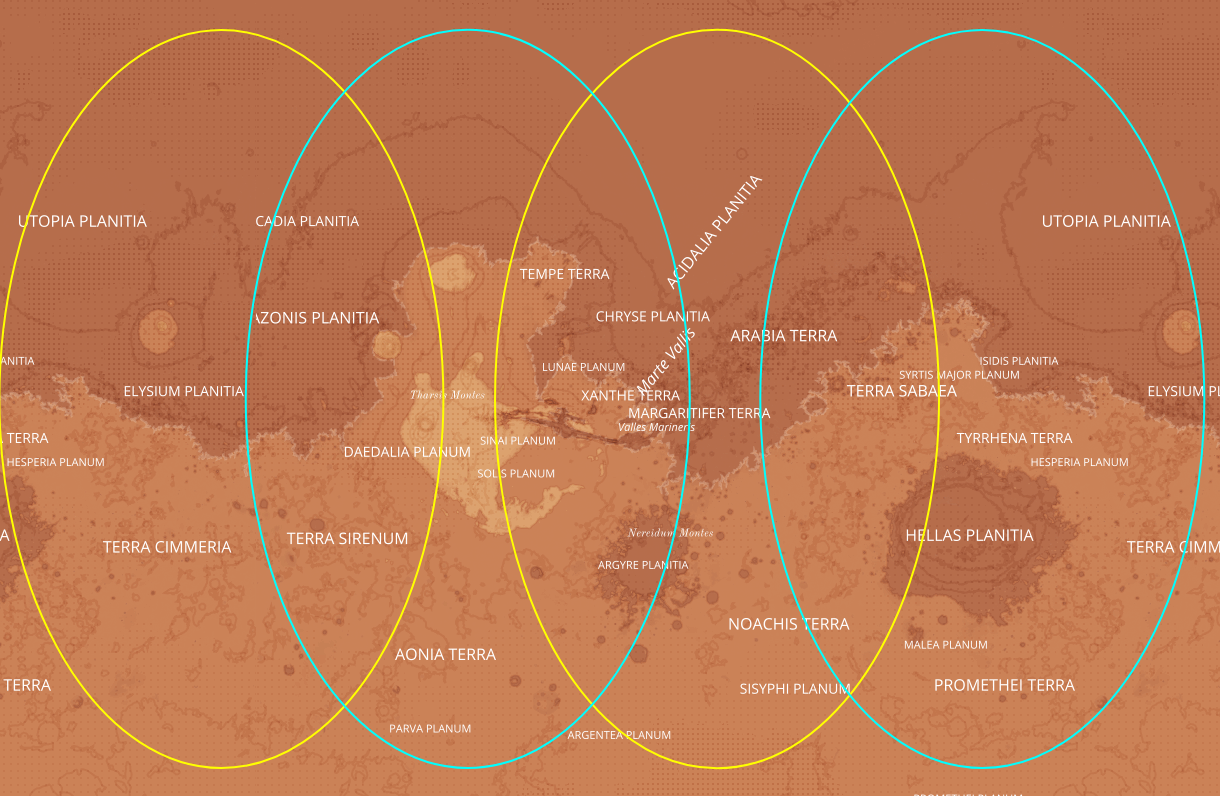 | 1,220 × 796 (670 KB) | Pb (talk | contribs) | correct coverage zone sizes |
| 04:41, 30 August 2018 | 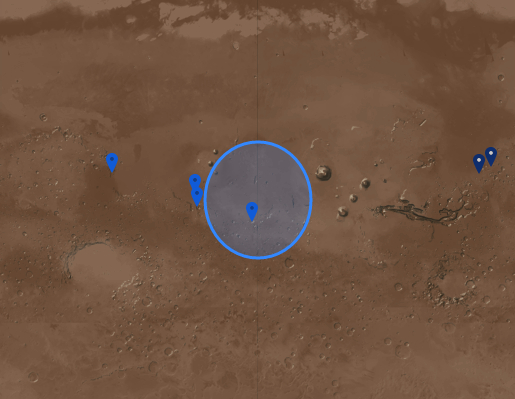 | 515 × 399 (177 KB) | Pb (talk | contribs) | A plot of an example computed coverage area for an areosynchronous satellite. The constraint used in this example is that the satellite must appear 10 degrees above the horizon in order to maintain coverage. The coverage zone in this image is centered... |
You cannot overwrite this file.
File usage
The following page uses this file:
